
Introduction
It goes without saying that implementing some type of metrics solution is an often neglected part of any organization’s digital transformation strategy. That said, not all solutions are made the same and many of them can have prohibitively expensive licensing fees. This is where OSS solutions such as Netdata can play a vital role in a company’s IT strategy.
To allow for swift adjustments, metrics must be based on real-time data as much as possible. In a world where data now increasingly drives decision-making across every imaginable realm, using it for internal progress would only make sense. Yet far too often, companies fail to use their data for this purpose.
What is Netdata?
Netdata is a distributed, real-time, performance and health monitoring for systems and applications. It is a highly-optimized monitoring agent you install on all your systems and containers.
Netdata provides insights of everything happening on the systems it runs (including web servers, databases, applications), using interactive web dashboards. It can run autonomously, without any third-party components, or it can be integrated into existing monitoring toolchains (Prometheus, Graphite, OpenTSDB, Kafka, Grafana, and more).

Netdata is built around 4 principles:
- Per second data collection for all metrics: It is impossible to monitor a 2 second SLA, with 10 second metrics.
- Collect and visualize all the metrics from all possible sources: To troubleshoot slowdowns, we need all the available metrics. The console should not provide more metrics.
- Meaningful presentation, optimized for visual anomaly detection: Metrics are a lot more than name-value pairs over time. The monitoring tool should know all the metrics. Users should not!
- Immediate results, just install and use: Most of our infrastructure is standardized. There is no point to configure everything metric by metric.
Unlike other monitoring solutions that focus on metrics visualization, Netdata helps you troubleshoot slowdowns without touching the console.
What can I monitor?
Netdata data collection is extensible – you can monitor anything you can get a metric for. Its Plugin API supports all programing languages (anything can be a Netdata plugin, BASH, Python, Perl, Node.js, Java, Go, Ruby, etc).
- For better performance, most system-related plugins (CPU, memory, disks, filesystems, networking, etc) have been written in
C. - For faster development and easier contributions, most application related plugins (databases, web servers, etc) have been written in
python.
So the world is your oyster with Netdata, and it’s better than paying for a super expensive enterprise license.
Installing Netdata
You can install Netdata in a variety of ways depending on your desired scenario.
One line Install
To install Netdata from source, and keep it up to date with our nightly releases automatically, run the following:
bash <(curl -Ss https://my-netdata.io/kickstart.sh)
Docker Install
Quickly start Netdata with the docker command. Netdata is then available at http://host:19999.
docker run -d --name=netdata \
  -p 19999:19999 \
  -v /etc/passwd:/host/etc/passwd:ro \
  -v /etc/group:/host/etc/group:ro \
  -v /proc:/host/proc:ro \
  -v /sys:/host/sys:ro \
  -v /etc/os-release:/host/etc/os-release:ro \
  --cap-add SYS_PTRACE \
  --security-opt apparmor=unconfined \
  netdata/netdata
The above can be converted to a docker-compose.yml file for ease of management:
version: '3'
services:
  netdata:
    image: netdata/netdata
    hostname: example.com # set to fqdn of host
    ports:
      - 19999:19999
    cap_add:
      - SYS_PTRACE
    security_opt:
      - apparmor:unconfined
    volumes:
      - /etc/passwd:/host/etc/passwd:ro
      - /etc/group:/host/etc/group:ro
      - /proc:/host/proc:ro
      - /sys:/host/sys:ro
Access the dashboard
Open up your web browser of choice and navigate to http://YOUR-HOST:19999. Welcome to Netdata!
Navigating the standard dashboard
Beyond charts, the standard dashboard can be broken down into three key areas:
- Sections
- Menus/Submenus
- Nodes menu
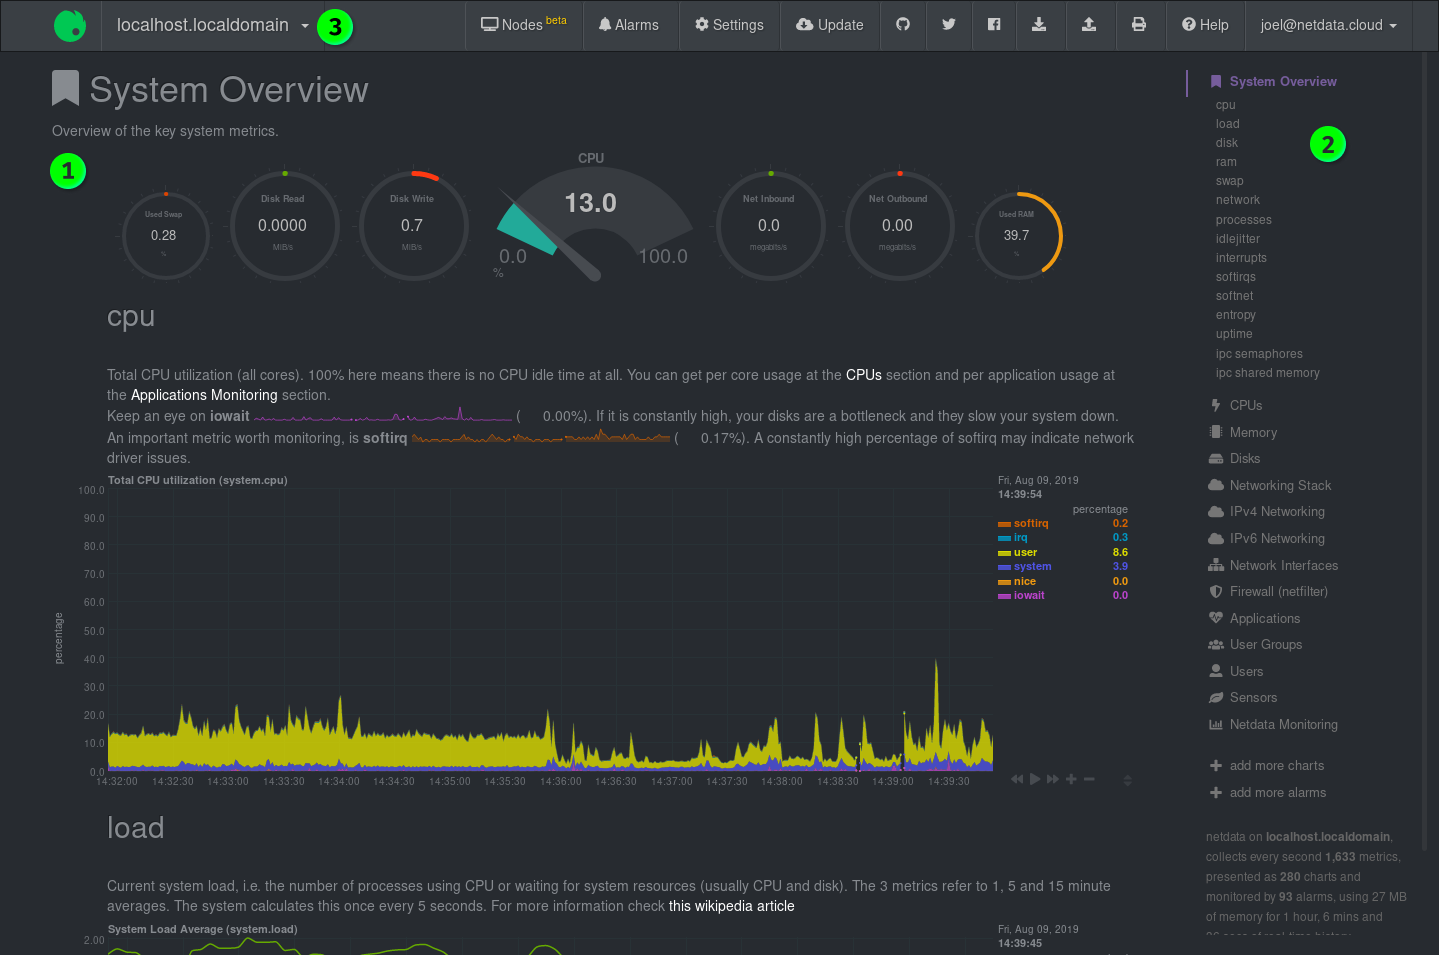
Sections
Netdata is broken up into multiple sections, such as System Overview, CPU, Disk, and more. Inside each section, you’ll find a number of charts, broken down into contexts and families.
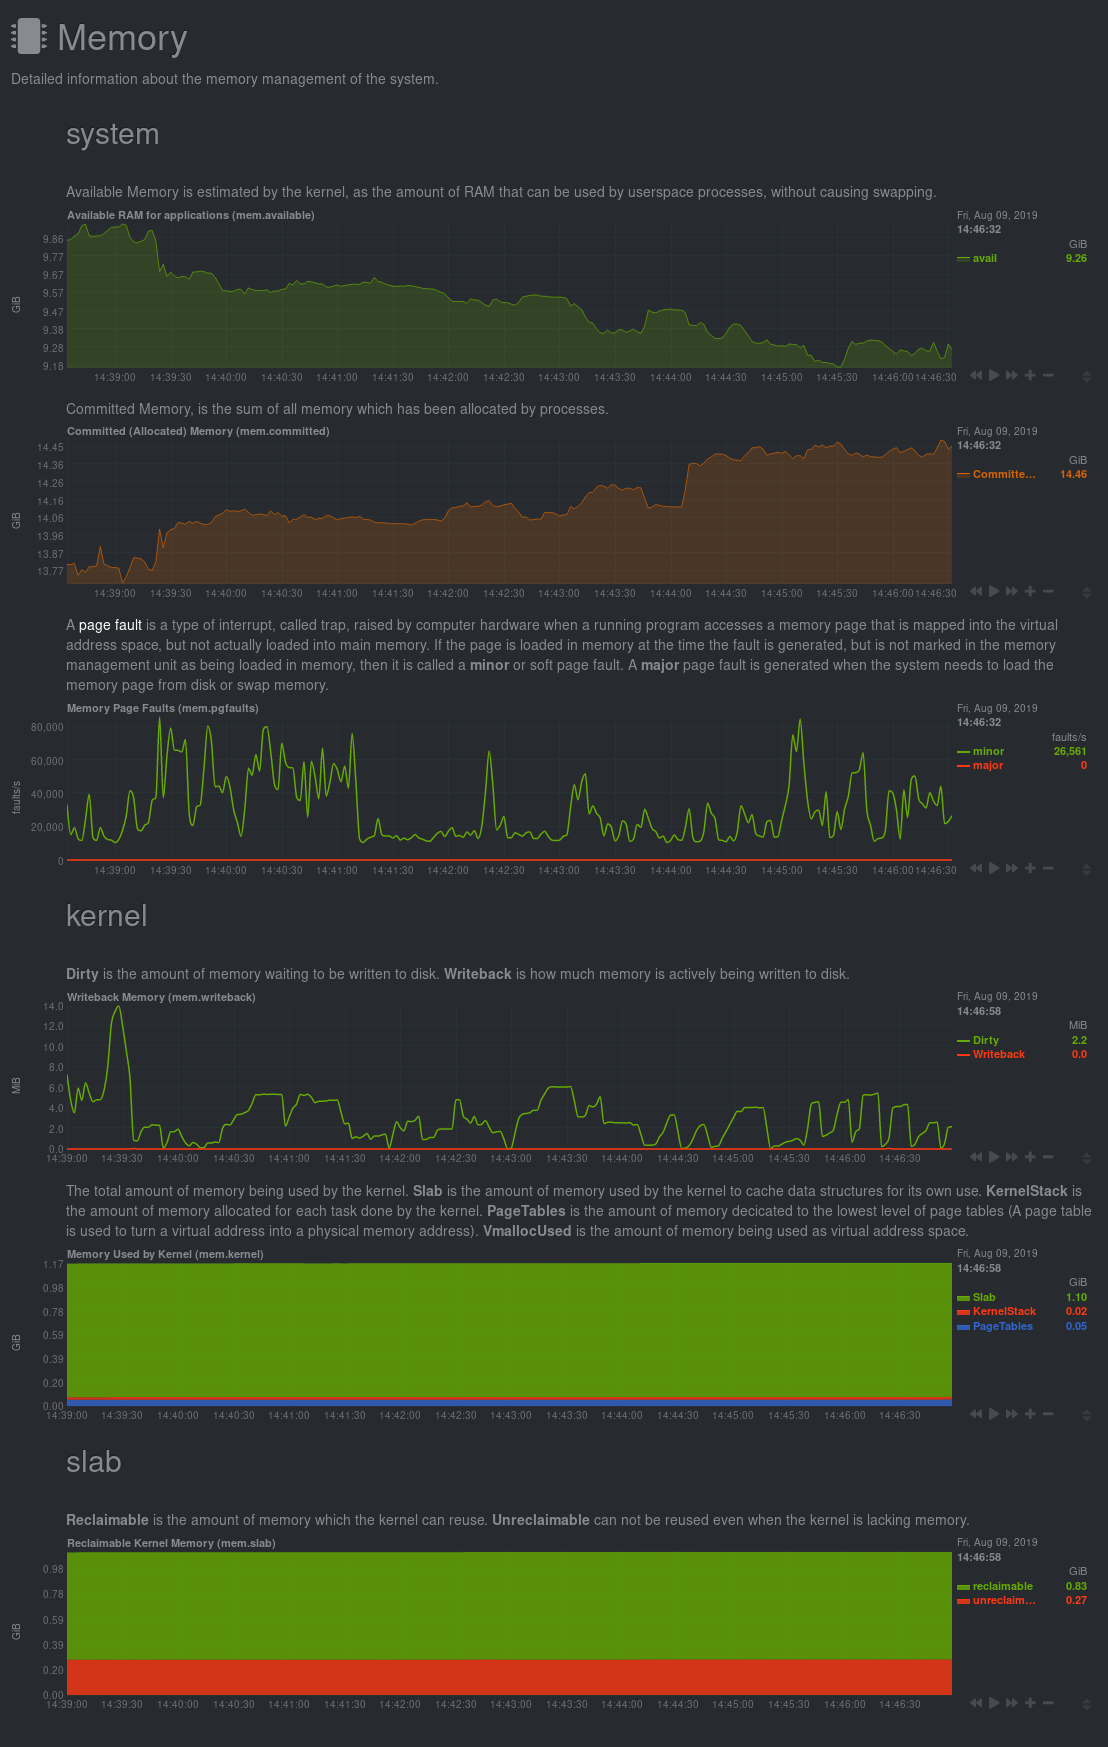
An example of the Memory section on a Linux desktop system.
All sections and their associated charts appear on a single “page,” so all you need to do to view different sections is scroll up and down the page. But it’s usually quicker to use the menus.
Menus
Menus appears on the right-hand side of the standard dashboard. Netdata generates a menu for each section, and menus link to the section they’re associated with.
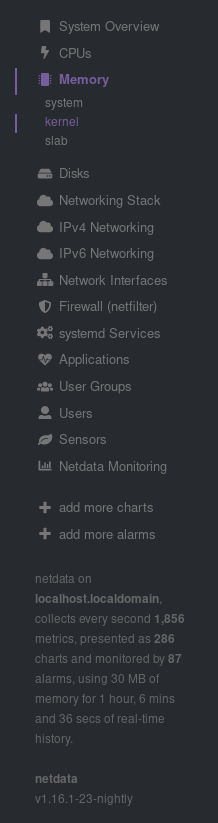
Most menu items will contain several Submenu entries, which represent any families from that section. Netdata automatically generates these Submenu entries.
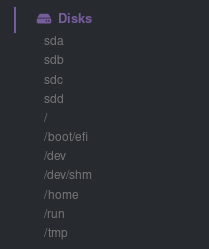
Here’s a Disks menu with several submenu entries for each disk drive and partition Netdata recognizes.
Nodes menu
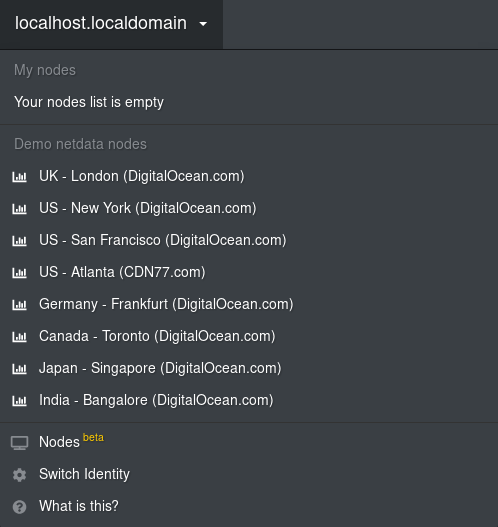
The nodes menu appears in the top-left corner of the standard dashboard and is labeled with the hostname of the system Netdata is monitoring.
Clicking on it will display a drop-down menu of any nodes you might have connected via the Netdata registry. By default, you’ll find nothing under the My nodes heading, but you can try out any of the Demo Netdata Nodes to see how the nodes menu works.
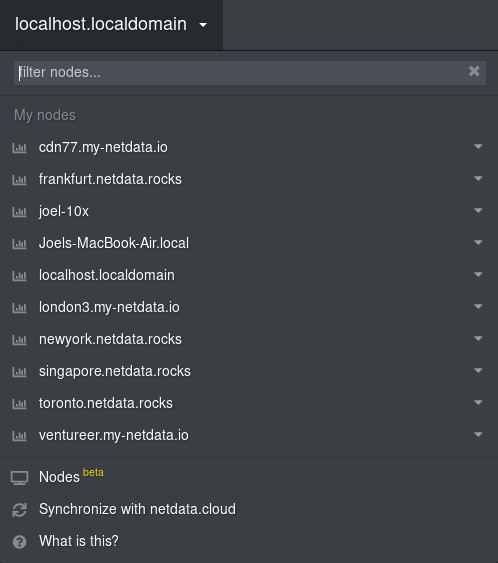
Once you add nodes via Netdata Cloud or a private registry, you will see them appear under the My nodes heading.
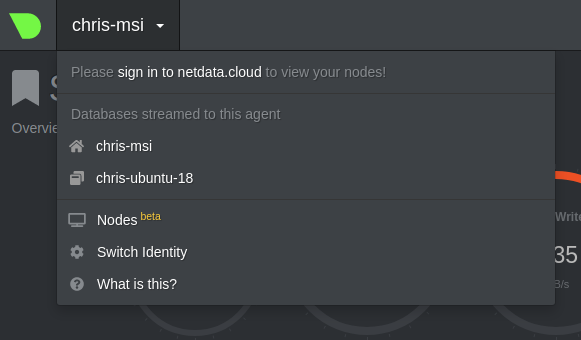
The nodes menu will also show the master netdata node and all slave nodes streaming to that master, if you have configured streaming.
Customizing the standard dashboard
Netdata stores information about individual charts in the dashboard_info.js file. This file includes section and subsection headings, descriptions, colors, titles, tooltips, and other information for Netdata to render on the dashboard.
For example, here is how dashboard_info.js defines the System Overview section.
netdataDashboard.menu = {
  'system': {
    title: 'System Overview',
    icon: '<i class="fas fa-bookmark"></i>',
    info: 'Overview of the key system metrics.'
  },
If you want to customize this information, you should avoid editing dashboard_info.js directly. These changes are not persistent; Netdata will overwrite the file when it’s updated. Instead, you should create a new file with your customizations.
That’s it!
Now you’re ready to monitor your metrics in real time with Netdata dashboards. I hope you liked this article and better yet learned something from it. Thanks for reading! See you next time.